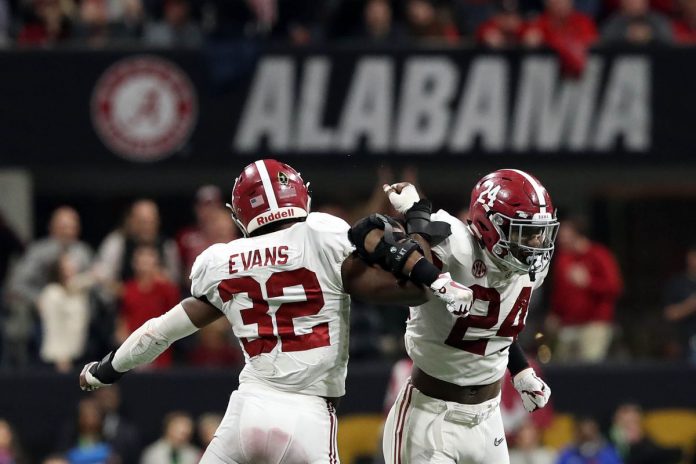
College football has a very diverse landscape. The Big 12 Conference is known for high-scoring shootouts and the spread offense. The SEC has established its reputation as a league of bruising defenses, where points are hard to come by. The Big Ten is a little bit of both. Conferences have different styles, teams have different athletes, and coaches have different philosophies.
Because of the stark differences in the way the game is played across the country, and the sheer number of teams, some statistics can be misleading. Some teams like Oklahoma have made a living with high-octane spread offenses that operate at a lighting-quick pace and put up points in a hurry. Other teams, like Army, Navy, and Georgia Tech, run the triple-option which churns out long, bruising drives that take oodles of time off the clock. In between, some teams score lots of points, but aren’t efficient in doing so because of drive inflation.

By analyzing a team’s points per drive rather than points per game, we can gain a better understanding of how effective their offense (or defense) truly is. The same goes for yards per play. These types of “rate stats” are a more accurate reflection of how good a team really is. However, like all statistics, they are by no means perfect. Below, we’ll take a look at the nation’s best—and worst—in drive efficiency.
Points Per Drive
In general, there are six ways in which a football drive can end: (1) touchdown, (2) punt, (3) field goal attempt, (4) turnover, (5) turnover on downs, and (6) safety. Some drives will also end with the clock running out at the end of the first or second half. For the purpose of this article, those drives are not included. Many teams are not attempting to score in such situations, or have no expectations to do so. First, a look at the nation’s leaders and losers in Offensive Points per Drive:
Top 10: Offensive Points per Drive
| Team | Off Points/Drive |
| UCF | 4.60 |
| Alabama | 4.20 |
| Oklahoma | 4.13 |
| Georgia | 3.61 |
| Ohio State | 3.59 |
| Georgia Tech | 3.57 |
| Memphis | 3.52 |
| Penn State | 3.41 |
| West Virginia | 3.22 |
| Washington State | 3.19 |
Bottom 10: Offensive Points per Drive
| Team | Off Points/Drive |
| Akron | 1.08 |
| Connecticut | 1.12 |
| Rutgers | 1.15 |
| Central Michigan | 1.27 |
| Northern Illinois | 1.29 |
| New Mexico State | 1.33 |
| Arkansas State | 1.33 |
| Florida State | 1.34 |
| Louisiana-Monroe | 1.34 |
| Wyoming | 1.35 |
NOTE:
- These statistics include only games played against FBS teams.
- As the table indicates, only points scored by the offensive are included. This would exclude defensive touchdowns (fumble returns, pick sixes, kickoff/punt returns, etc.) and safeties. This goes for a team’s defense as well.
Now, the nation’s top ten and bottom ten defenses:
Top 10: Defensive Points per Drive
| Team | Def Points/Drive |
| Florida | 1.17 |
| Cincinnati | 1.17 |
| Kentucky | 1.18 |
| Clemson | 1.19 |
| Auburn | 1.22 |
| Alabama | 1.26 |
| Fresno State | 1.30 |
| Appalachian State | 1.32 |
| Michigan | 1.35 |
| North Carolina State | 1.36 |
Bottom 10: Defensive Points per Drive
| Team | Def Points/Drive |
| Connecticut | 4.75 |
| Oregon State | 4.21 |
| Louisiana-Lafayette | 4.15 |
| Bowling Green | 3.87 |
| Massachusetts | 3.66 |
| Coastal Carolina | 3.56 |
| Louisiana-Monroe | 3.53 |
| Kent State | 3.40 |
| Georgia State | 3.27 |
| Louisville | 3.17 |
Of course, there are some teams with great offenses and poor defenses. Other teams have great defenses but struggle to move the ball. Combine the two statistics and you come up with Net Points per Drive.
Top 10: Net Points per Drive
| Team | Net Points/Drive |
| Alabama | 2.94 |
| UCF | 2.83 |
| Georgia | 2.24 |
| Ohio State | 2.09 |
| Penn State | 2.01 |
| Clemson | 1.81 |
| Michigan | 1.80 |
| North Carolina State | 1.76 |
| Oklahoma | 1.72 |
| Appalachian State | 1.60 |
Bottom 10: Net Points per Drive
| Team | Net Points/Drive |
| Connecticut | -3.63 |
| Louisiana-Monroe | -2.20 |
| Bowling Green | -2.14 |
| Louisiana-Lafayette | -1.92 |
| Oregon State | -1.90 |
| Kent State | -1.83 |
| Louisville | -1.64 |
| Rutgers | -1.63 |
| Rice | -1.58 |
| South Alabama | -1.57 |

As mentioned before, no metric is perfect. This statistic does not account for defensive and special teams scores. It also does not take into account strength of schedule (those types of strength-of-schedule conversions are a story for another day). But Net Points per Drive gives a solid overview of a team’s efficiency, and is a fairly easy calculation for any football fanatic with access to spreadsheets and some time on their hands.
In the next Pypeline Projections, I’ll be taking a closer look at turnover margin. I’ll examine how certain teams’ struggles with giving the ball up may not be as much a matter of skill as some fans may think.


